


Debug Drawing Extension API#
About#
This Debug Drawing Extension API API is used to coordinate groups of lines and points on the screen. Use this API instead of Omniverse’s built-in debug drawing API to have greater control over how the geometry is drawn. The 3D geometry drawn by this remains persistent across frames and is only cleared when desired (unlike the built-in debug drawer).
API Documentation#
See the API Documentation for complete usage information.
Tutorials & Examples#
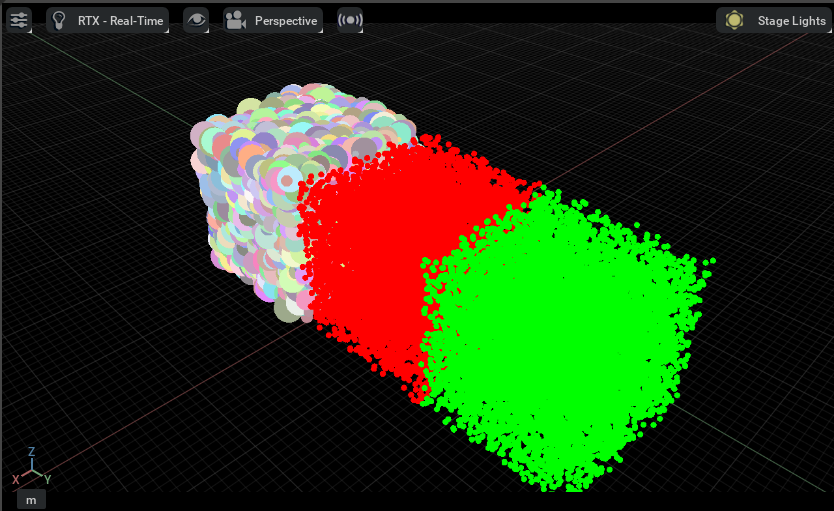
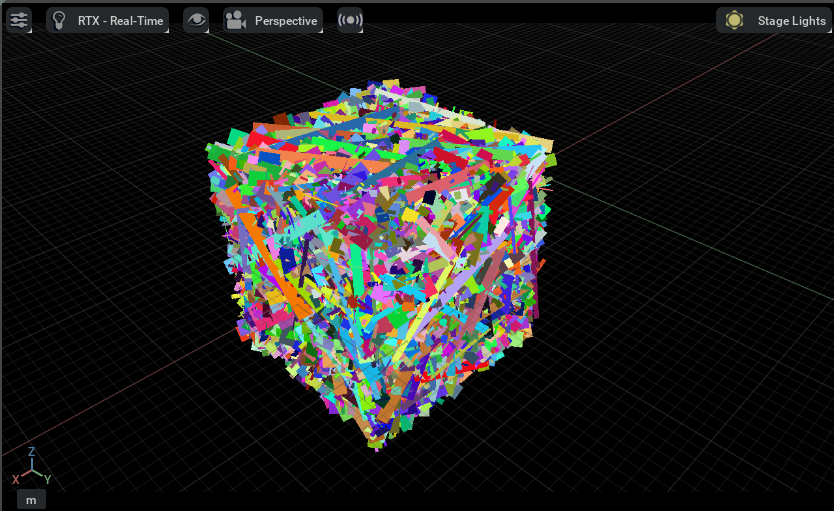
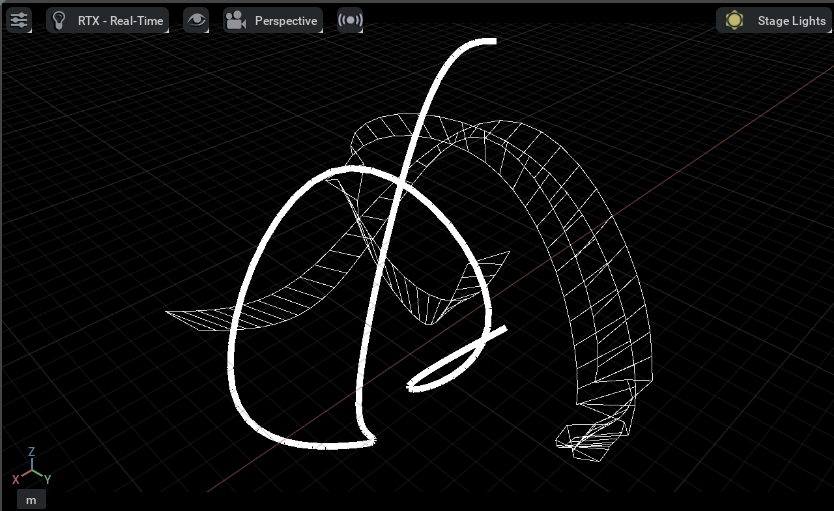
The following screenshots showcase how the different geometries are drawn:
Points#
Drawing batches of points with different RGBA and radius values:
import random

from isaacsim.util.debug_draw import _debug_draw

draw = _debug_draw.acquire_debug_draw_interface()

N = 10000
point_list_1 = [(random.uniform(-10, 10), random.uniform(-10, 10), random.uniform(-10, 10)) for _ in range(N)]
point_list_2 = [(random.uniform(-10, 10), random.uniform(10, 30), random.uniform(-10, 10)) for _ in range(N)]
point_list_3 = [(random.uniform(-10, 10), random.uniform(-30, -10), random.uniform(-10, 10)) for _ in range(N)]
colors = [(random.uniform(0.5, 1), random.uniform(0.5, 1), random.uniform(0.5, 1), 1) for _ in range(N)]
sizes = [random.randint(1, 50) for _ in range(N)]
draw.draw_points(point_list_1, [(1, 0, 0, 1)] * N, [10] * N)
draw.draw_points(point_list_2, [(0, 1, 0, 1)] * N, [10] * N)
draw.draw_points(point_list_3, colors, sizes)
Lines#
Drawing batches of lines with different RGBA and width values:
import random

from isaacsim.util.debug_draw import _debug_draw

draw = _debug_draw.acquire_debug_draw_interface()

N = 10000
point_list_1 = [(random.uniform(10, 30), random.uniform(-10, 10), random.uniform(-10, 10)) for _ in range(N)]
point_list_2 = [(random.uniform(10, 30), random.uniform(-10, 10), random.uniform(-10, 10)) for _ in range(N)]
colors = [(random.uniform(0, 1), random.uniform(0, 1), random.uniform(0, 1), 1) for _ in range(N)]
sizes = [random.randint(1, 25) for _ in range(N)]
draw.draw_lines(point_list_1, point_list_2, colors, sizes)
Splines#
Drawing splines as filled or dashed between a set of points:
import random

from isaacsim.util.debug_draw import _debug_draw

draw = _debug_draw.acquire_debug_draw_interface()

point_list_1 = [(random.uniform(-30, -10), random.uniform(-10, 10), random.uniform(-10, 10)) for _ in range(10)]
draw.draw_lines_spline(point_list_1, (1, 1, 1, 1), 10, False)
point_list_2 = [(random.uniform(-30, -10), random.uniform(-10, 10), random.uniform(-10, 10)) for _ in range(10)]
draw.draw_lines_spline(point_list_2, (1, 1, 1, 1), 1, True)
Point Cloud Export, Import, and Coloring#
The following standalone examples cover the full point cloud workflow: exporting a Lidar scan to disk, reloading it, and coloring points by a per-point scalar field.
Export a Lidar point cloud to disk
Runs a LidarSensor, captures the first valid scan, and saves it as a point_cloud.npz file
that can be consumed by import_point_cloud.py or any NumPy-aware tool:
./python.sh standalone_examples/api/isaacsim.sensors.experimental.rtx/export_point_cloud.py \
    --output-file /tmp/my_cloud.npz
Import and display a saved point cloud
Loads a point_cloud.npz file produced by export_point_cloud.py and renders it in the
viewport via an OmniGraph DebugDrawPointCloud node. The --color and --size flags
control the uniform RGBA and point radius:
./python.sh standalone_examples/api/isaacsim.util.debug_draw/import_point_cloud.py \
    --input-file /tmp/my_cloud.npz --color 0.0 1.0 0.5 1.0 --size 0.02

Color a live Lidar point cloud by distance or intensity
Builds an IsaacExtractRTXSensorPointCloud → IsaacMapScalarsToColors →
DebugDrawPointCloud OmniGraph pipeline that colors each point by the chosen scalar field in
real time. Use --scalar intensity to switch fields:
./python.sh standalone_examples/api/isaacsim.util.debug_draw/test_lidar_point_cloud_coloring.py \
    --scalar distance

Color a live Radar point cloud by radial velocity (Doppler)
The same coloring pipeline applied to an RTX Radar. Target cubes oscillate toward and away from
the sensor each frame so the Doppler signal is nonzero. Motion BVH must be enabled (passed via
SimulationApp):
./python.sh standalone_examples/api/isaacsim.util.debug_draw/test_radar_point_cloud_coloring.py
