


ROS 2 Setting Publish Rates#
Learning Objectives#
In this example, you learn to:
Set different publish rates for different sensor types (IMU, RTX Lidar, Camera) publishing to ROS 2 simultaneously.
Set the simulation frame rate in Isaac Sim.
Check the resulting ROS 2 publish rates with Greenwave Monitor.
Getting Started#
Prerequisite
Completed the URDF Import: Turtlebot, ROS 2 Cameras, RTX Lidar Sensors, and ROS 2 Transform Trees and Odometry tutorials.
Completed ROS 2 installation so that ROS 2 is available and the ROS 2 extension is enabled.
Built and sourced the Isaac Sim ROS workspace that matches your ROS 2 distribution. The Humble and Jazzy workspaces include Greenwave Monitor for topic-rate monitoring.
Setting Publish Rates with OmniGraph#
Action Graphs are ticked every simulation frame and therefore OmniGraph nodes are bound to the factors of the simulation rate. This tutorial explains how to configure publishing ROS 2 nodes at these factors of simulation.
Non-RTX Sensors#
Sensors which do not rely on RTX rendering, such as IMU sensors, can be configured to publish at a different rate than the simulation rate using the Isaac Simulation Gate node.
Open the turtlebot simple room scene, which can be found by going to the Isaac Sim Content browser and clicking Isaac Sim>Samples>ROS2>Scenario>turtlebot_tutorial.usd.
Create an IMU sensor parented under the imu_link prim. There are two ways to add an IMU sensor, and they place it at different locations in the stage:
Right-click menu (recommended): In the Stage panel, right-click the prim
/World/turtlebot3_burger_processed/Geometry/base_footprint/base_link/imu_linkand choose Create > Isaac > Sensors > Imu Sensor from the context menu. This parents the sensor directly under the selected imu_link prim.Menu bar: The top Create > Sensors > Imu Sensor menu-bar entry creates the sensor at the stage root instead. If you use this path, drag the resulting sensor prim under imu_link in the Stage panel so the hierarchy matches the rest of this tutorial.
Either way, verify that the Imu sensor ends up under the imu_link prim before continuing.
Create a new Action Graph inside /World/turtlebot3_burger_processed/Geometry/base_footprint/base_link/imu_link prim and name it ROS_IMU (the placement of the graph is important for Automatic ROS 2 Namespace Generation). To do this, select the prim at
/World/turtlebot3_burger_processed/Geometry/base_footprint/base_link/imu_linkand then create an Action Graph by going to Window > Graph Editors > Action Graph.Make the graph for IMU including the simulation gate node and attach the graph as shown below.
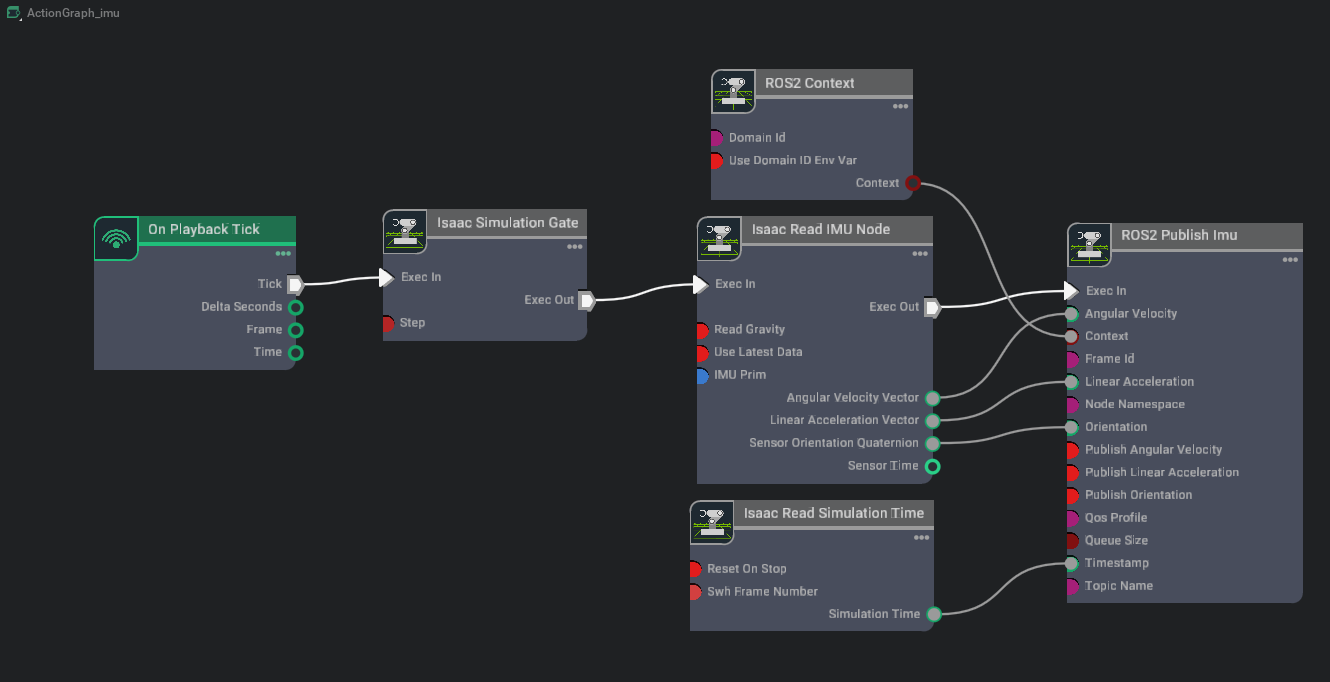
Set the following attributes for each node as such:
In the Property tab for the Isaac Simulation Gate node:
Set the step attribute to
2. Having a step size of2means that downstream nodes will be ticked every other frame.
In the Property tab for the Isaac Read IMU Node:
Add the IMU sensor prim
/World/turtlebot3_burger_processed/Geometry/base_footprint/base_link/imu_link/Imu_Sensorto its imuPrim input field.
In the Property tab for the ROS2 Publish Imu node:
Set the frameId attribute to
imu_link. This will match theimu_linkframe used in the TF tree that is already being published by the TF publisher, which you created in Setting Up Odometry.
RTX Sensors#
Cameras and RTX Lidars can be configured to publish at a different rate than the simulation rate using the omni:sensor:tickRate attribute on the sensor prim, described in Configuring Per-Sensor Tick Rates.
Warning
Previous versions of Isaac Sim used the frameSkipCount parameter on ROS 2 helper nodes to control sensor publish rates. This is now deprecated.
If frameSkipCount is set to a non-zero value, and the corresponding sensor prim has omni:sensor:tickRate set to a non-zero value, message publishing frequency may be unexpected as the frameSkipCount may not
align periodically with the sensor’s tick rate. See Configuring Per-Sensor Tick Rates, and
Multi-Tick Rendering for the full migration guide.
Select the 2D Lidar prim
/World/turtlebot3_burger_processed/Geometry/base_footprint/base_link/base_scan/Example_Rotary_2D(theOmniLidarreferenced ascameraPrimon theIsaac Create Render Productnode feeding/World/turtlebot3_burger_processed/Geometry/base_footprint/base_link/base_scan/ROS_LidarRTX/LaserScanPublish). In the Property tab:Set
omni:sensor:tickRateto5. The laser scan publishes once per tick, so this yields a publish rate ofR_lidar = 5Hz (independent of the simulation rate, as long as the simulation rate is at least 5 Hz).Set
omni:sensor:Core:scanRateBaseHzto5to match. The two values must be equal so the Lidar accumulates a full scan per tick instead of falling back to per-frame partial scans (see OmniLidar Tick Rate Must Equal scanRateBaseHz). The shippedExample_Rotary_2Dasset defaults to10, so you must lower it.
Because you don’t need to publish a point cloud in this tutorial, select the Ros2RTXLidarHelper node for point cloud and disable it by unchecking enabled attribute in /World/turtlebot3_burger_processed/Geometry/base_footprint/base_link/base_scan/ROS_LidarRTX/PointCloudPublish.
Open the camera Action Graph /World/ActionGraph_camera. Disable the second camera render product by unchecking enabled attribute in /World/ActionGraph_camera/isaac_create_render_product_01.
Select the camera prim
/World/Camera_1(theCamerareferenced ascameraPrimon theIsaac Create Render Productnode feeding both/World/ActionGraph_camera/ros2_camera_helperand/World/ActionGraph_camera/ros2_camera_info_helper). Apply theOmniSensorAPIschema and setomni:sensor:tickRateto15so that both/camera_1/rgb/image_rawand/camera_1/rgb/camera_infopublish atR_cam = 15Hz (independent of the simulation rate, as long as the simulation rate is at least 15 Hz). Run the following from the Script Editor (Window > Script Editor) to apply the schema and set the rate on each camera:import isaacsim.core.experimental.utils.prim as prim_utils # Cameras created from the Create > Camera menu lack the OmniSensorAPI schema, # so omni:sensor:tickRate is unavailable until the schema is applied. Apply it to # each existing camera, then set the publish rate (Hz). for path in ("/World/Camera_1", "/World/Camera_2"): camera_prim = prim_utils.get_prim_at_path(path) camera_prim.ApplyAPI("OmniSensorAPI") camera_prim.GetAttribute("omni:sensor:tickRate").Set(15)
Note
Cameras created from the top Create > Camera menu bar (as in the prerequisite ROS 2 Cameras) do not carry the
omni:sensor:tickRateattribute by default, because they lack theOmniSensorAPIschema; the shippedturtlebot_tutorial.usdalready has the schema applied to/World/Camera_1and/World/Camera_2. Once the schema is applied, you can also adjustomni:sensor:tickRatedirectly in the Property tab.You don’t need to publish depth images from Camera1 for this tutorial. Disable the camera helper for depth images by unchecking enabled attribute in /World/ActionGraph_camera/ros2_camera_helper_02.
Setting the Simulation Rate#
With the sensor graphs and per-sensor tick rates in place, set the rate at which the scene itself runs. The simulation rate bounds every OmniGraph-driven publisher and determines the wall-clock rate you measure in the next section.
Isaac Sim has three rate-related clocks: the physics scene’s step rate (UsdPhysicsScene.timeStepsPerSecond), the timeline’s per-tick dt (stage.timeCodesPerSecond combined with the timeline’s targetFramerate), and the application’s run-loop tick rate (/app/runLoops/main/rateLimitFrequency). For real-time playback you want all three set coherently to the same value. isaacsim.core.simulation_manager.SimulationManager.setup_simulation() configures the physics scene’s step rate; isaacsim.core.rendering_manager.RenderingManager.set_dt() configures the timeline and run-loop together. Use them as a pair.
Run the following snippet from the Script Editor (Window > Script Editor) before pressing Play. Set target_hz to the rate you want from the table below.
from isaacsim.core.rendering_manager import RenderingManager
from isaacsim.core.simulation_manager import SimulationManager

# Set physics, timeline, and run-loop rates coherently before pressing Play.
# Assumes `/app/runLoops/main/rateLimitEnabled` is true (default in the full
# Isaac Sim GUI app; false in `isaacsim.exp.base.kit` / standalone Python). If
# it is false, set it to True first or the loop will tick unthrottled. See the
# `RenderingManager.set_dt` docstring for the full effect list.
target_hz = 60
SimulationManager.setup_simulation(dt=1.0 / target_hz)  # physics_dt
RenderingManager.set_dt(1.0 / target_hz)  # loop_dt, manual mode, timeCodesPerSecond, targetFramerate
With the default target_hz = 60, the simulation runs at 60 frames per wall-clock second (FPS).
Each topic scales differently with target_hz because the topics are gated by two different mechanisms.
OnPlaybackTick-driven helpers (
/clockpublisher and the IMU graph through its Isaac Simulation Gate) fire once per app update, so their wall-clock rate scales linearly withtarget_hz(divided by the gatestepfor IMU).Multi-tick-scheduled RTX sensors (
/scan,/camera_1/rgb/image_raw,/camera_1/rgb/camera_info) fire when the renderer’s simulation time has advanced by1 / omni:sensor:tickRate, so they hold at the configured Hz independently oftarget_hz- untiltarget_hzdrops below the configured tick rate, at which point the sensor is capped at one tick per app update. See Architecture: Timeline, Physics, and the Renderer for the underlying machinery.
For the tutorial setup (R_lidar = omni:sensor:tickRate = 5 on the Lidar prim, R_cam = omni:sensor:tickRate = 15 on the Camera prim, IMU gate step = 2), the wall-clock publish rates are:
|
|
|
|
|
|---|---|---|---|---|
30 |
30 |
15 |
5 |
15 |
60 |
60 |
30 |
5 |
15 |
120 |
120 |
60 |
5 |
15 |
240 |
240 |
120 |
5 |
15 |
10 |
10 |
5 |
5 |
10 (capped at |
The publish rates are estimated. On a high-performance machine the maximum FPS would be closer to the target_hz set in the snippet above (default of 60 Hz). Checking ROS 2 Publish Rate shows how to measure the rates you actually get and compare them against this table.
Important
Actual frame rate is dependent on your machine’s performance. If the renderer cannot sustain target_hz, sensor publish rates will fall proportionally. For the relationship between the three clocks and what happens when they fall out of sync (slow-motion, fast-forward), see Architecture: Timeline, Physics, and the Renderer.
The general formulas are:
clock_hz   = target_hz
imu_hz     = target_hz / k_imu                 # k_imu = Isaac Simulation Gate step (= 2 here)
scan_hz    = min(R_lidar, target_hz)
camera_hz  = min(R_cam, target_hz)
Note
The /camera_1/rgb/image_raw (and /camera_1/rgb/camera_info) publish rate may fall below the table’s predicted value even when the multi-tick scheduler is firing at the configured R_cam Hz. The RGB image path is computationally heavier than the other topics: the render product cost scales with resolution, and the published image size also stresses the DDS / network layer. If the observed rate is below R_cam, the two knobs to try first are (1) lowering the render product resolution on /World/ActionGraph_camera/isaac_create_render_product, and (2) lowering omni:sensor:tickRate on the /World/Camera_1 prim to reduce render frequency.
Note
If you change omni:sensor:tickRate on the Lidar prim, you must change omni:sensor:Core:scanRateBaseHz to match. The two values must be equal or the Lidar emits partial scans every frame instead of accumulating a full scan per tick; see OmniLidar Tick Rate Must Equal scanRateBaseHz.
Checking ROS 2 Publish Rate#
Press Play to start the simulation. If you change
target_hz, rerun the snippet in Setting the Simulation Rate and press Play again before measuring.In a separate ROS 2-sourced terminal, run Greenwave Monitor for all tutorial topics from one process. For the Pixi workflow on Windows, run the same command from the ROS workspace directory that matches your distribution, such as
jazzy_wsfor Jazzy orhumble_wsfor Humble, withpixi runor enterpixi shellfirst:ros2 run greenwave_monitor greenwave_monitor --ros-args \ -p gw_monitored_topics:='["/clock","/imu","/scan","/camera_1/rgb/image_raw","/camera_1/rgb/camera_info"]' \ -p gw_time_check_preset:=nodetime_only
This mode is the closest Greenwave equivalent to a wall-time
ros2 topic hzcheck because it measures message-arrival intervals at the Greenwave node. Greenwave also publishes results on/diagnostics. With Pixi, prefix the command withpixi run, for examplepixi run ros2 run greenwave_monitor greenwave_monitor --ros-args ....Greenwave can also compare a topic against an expected frequency, which is useful for dashboard inspection. The
greenwave_monitornode advertises the/greenwave_monitor/set_expected_frequencyservice after it starts. Isaac Sim does not advertise this service, so the service does not appear inros2 service listuntil Greenwave Monitor is running.Keep the
greenwave_monitorcommand running. Then, in another ROS 2-sourced terminal, set the expected IMU rate for the defaulttarget_hz = 60setup with:ros2 service call /greenwave_monitor/set_expected_frequency greenwave_monitor_interfaces/srv/SetExpectedFrequency \ "{topic_name: '/imu', expected_hz: 30.0, tolerance_percent: 10.0, clear_expected: false, add_topic_if_missing: true}"
The service call configures the expected rate. Inspect whether the measured rate is within tolerance in the Greenwave dashboard. In another ROS 2-sourced terminal, run:
ros2 run greenwave_monitor ncurses_dashboard --hide-unmonitored --ros-args \
    -p gw_monitored_topics:='["/clock","/imu","/scan","/camera_1/rgb/image_raw","/camera_1/rgb/camera_info"]' \
    -p gw_time_check_preset:=nodetime_only
If your Windows Pixi terminal does not support the ncurses frontend, use the non-dashboard
greenwave_monitorcommand above to monitor measured publish rates without dashboard inspection.If Greenwave is not available in your terminal,
ros2 topic hz /topic_nameremains a lightweight fallback for one topic at a time.Compare the measured rates against the table in Setting the Simulation Rate. The topics fall into two categories that scale differently with
target_hz:OnPlaybackTick-driven publishers (gated by app updates):
/clock:
target_hz(~60 Hz default; one message per app update)./imu:
target_hz / k_imu(~30 Hz default;k_imu = 2is the Isaac Simulation Gate step you set earlier).
Multi-tick-scheduled RTX sensors (gated by
/ExternalSimulationTimeand the per-sensoromni:sensor:tickRate, when the simulation runs in real time - i.e. the snippet from Setting the Simulation Rate was used):/scan:
min(R_lidar, target_hz) = 5Hz (constant intarget_hzas long astarget_hz >= 5)./camera_1/rgb/image_raw:
min(R_cam, target_hz) = 15Hz (constant intarget_hzas long astarget_hz >= 15)./camera_1/rgb/camera_info: same as RGB, because both helpers share the same Camera prim’s tick rate.
The file that contains all of the steps in this tutorial can be opened by going to the Isaac Sim Content browser and clicking Isaac Sim>Samples>ROS2>Scenario>turtlebot_tutorial_multi_sensor_publish_rates.usd. After opening the file, remember to run the snippet in Setting the Simulation Rate to set the target simulation rate.
Note
If you observe that the /camera_1/rgb/image_raw topic is publishing at a slower rate than anticipated, it might be because the large size of each image message is causing bottlenecks in network traffic or DDS queue management. To improve the publish rate, you can try reducing the dimensions of the render product resolution. This can be done by going to the render product node that is attached to the image publisher /World/ActionGraph_camera/isaac_create_render_product and modifying the dimensions before replaying the scene.
Troubleshooting#
If you observe much different publish rates from the target simulation frame rate, try the following:
Try running Isaac Sim with factory settings to clear any persistent simulation frame rate settings:
./isaac-sim.sh --reset-userCheck your computer’s CPU usage to identify bottlenecks. If Isaac Sim is exhibiting incredibly high usage try running with Fabric enabled:
./isaac-sim.fabric.sh --reset-userImportant
The above command is experimental and not all functionality of Isaac Sim is supported there. However you might observe better overall performance. You only need to use the
--reset-userflag the first time running with Fabric.
Sensor Rate Calculator#
Now that you understand how the simulation rate, sensor tick rate, and RTF interact, use the calculator below to estimate the expected wall-clock publish rate for your own sensor configuration.
For RTX sensors using the multi-tick scheduler, the expected wall-clock publish rate depends on three values:
Application FPS (
app_fps): the achieved application update rate, shown via (eye icon) > Heads Up Display > FPS in the viewport./app/runLoops/main/rateLimitFrequencycaps the rate forisaacsim.shworkflows (standalone Python scripts are uncapped by default). See Setting the Simulation Rate to set the simulation rate.Sensor tick rate (
omni:sensor:tickRate): the per-sensor schedule configured on the sensor prim.Real-Time Factor (RTF): the ratio of simulated time to wall-clock elapsed time. To read the RTF of a live simulation, follow the ROS 2 Publish Real Time Factor (RTF) tutorial.
The estimated wall-clock publish rate is:
publish_rate = min(RTF × sensor_tick_rate, app_fps)
Use the calculator below to estimate the expected publish rate for your sensor configuration.
Application FPS (app_fps) |
fps |
Sensor tick rate (omni:sensor:tickRate) |
Hz |
| Real-Time Factor (RTF) |
Estimated publish rate: 15.00 Hz (tick-rate limited)
Warning
The result above is a theoretical upper bound. Observed rates may be lower due to:
Render cost: high render-product resolutions increase per-frame GPU time, reducing
app_fpsbelow its configured target.DDS and network overhead: large messages such as high-resolution RGB images can saturate DDS queues or network bandwidth, causing dropped or delayed publishes.
RTF variability: RTF can fluctuate during a run. Use the ROS 2 Publish Real Time Factor (RTF) tutorial to monitor the live value and re-run the calculation if it changes significantly.
Note
Prefer Greenwave Monitor for this tutorial because it can monitor multiple
topics from one process, publish ROS diagnostics, and attach expected-rate
checks to each topic. ros2 topic hz remains useful for quick checks, but
it can under-report the true publish rate when message sizes are large, such
as high-resolution camera images.
Summary#
This tutorial covered:
Setting different publish rates for different sensor types: an Isaac Simulation Gate for non-RTX sensors (IMU), and
omni:sensor:tickRateon the sensor prim for RTX sensors (Lidar, Camera).Setting a coherent simulation rate using
SimulationManager.setup_simulationandRenderingManager.set_dtfrom the Script Editor.Using Greenwave Monitor as a multi-topic alternative to
ros2 topic hzand setting expected-rate diagnostics for the tutorial topics.Using the Sensor Rate Calculator to estimate the expected wall-clock publish rate from target FPS, sensor tick rate, and RTF.
Next Steps#
Continue on to the next tutorial in our ROS 2 Tutorials series, ROS 2 Putting It All Together, to assemble a complete ROS 2 navigation workflow.