Distribution Visualizer#
The distribution visualizer is a tool that allows you to visualize the distribution of a mutable attribute. It gives a visual clue through a dynamic point cloud, showing how possible an object is to be generated at a particular pose.
Concept#
A prim has its scene graph described by a list of xformOps. It can be a rotation followed by a translation, and then another rotation, for example. In IRO, each xformOp can be a mutable attribute. By controlling the distribution of each xformOp, we obtain an understanding of the global spatial probability distribution of the prim by visualization.
To Run#
Here is a step-by-step guide to using the distribution visualizer on a basic prim.
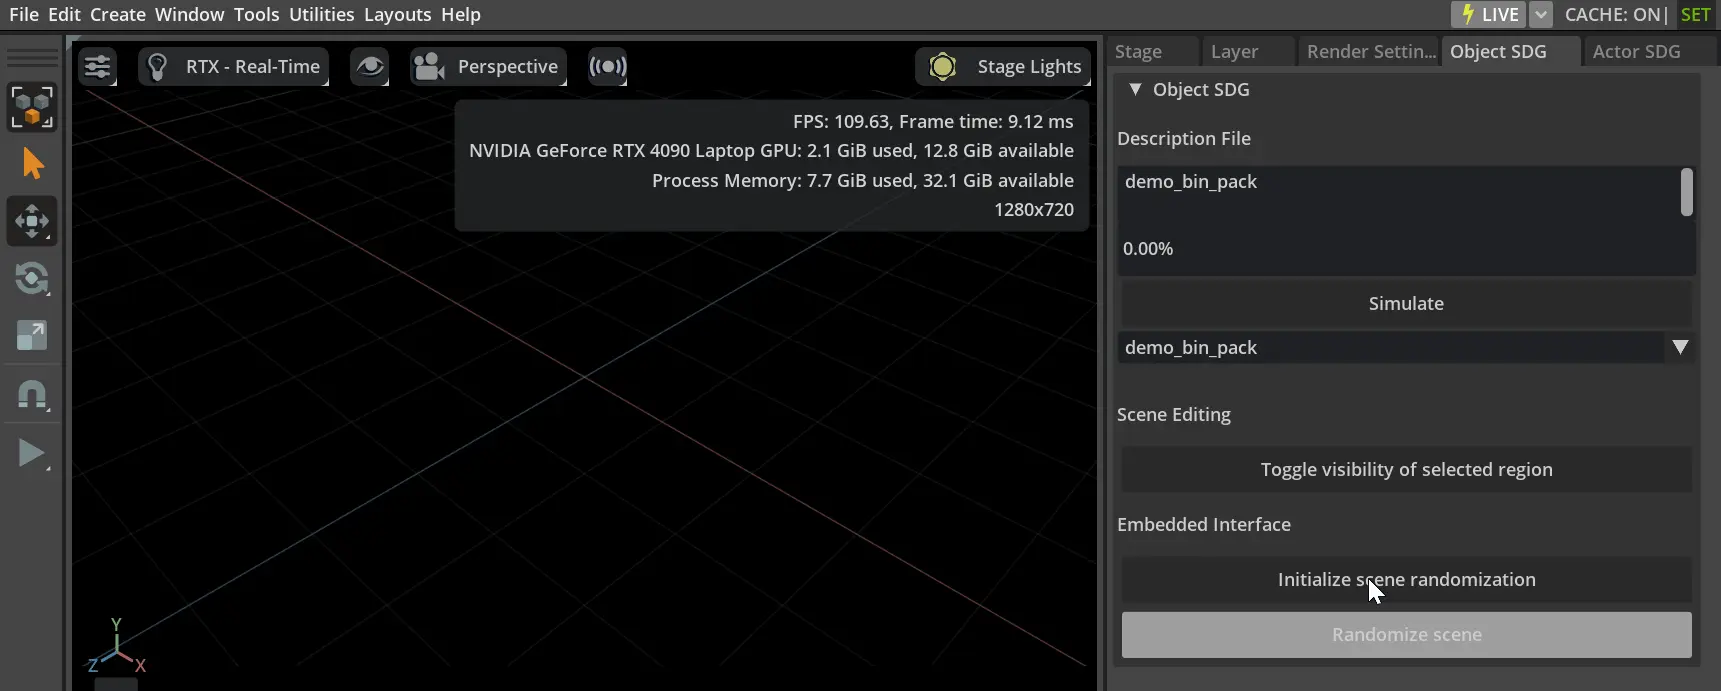
Click Tools > Action and Event Data Generation > Distribution Visualizer to open the distribution visualizer as shown below.
Create a torus, a dome light; focus on the torus by pressing “F”; and switch to path tracing mode, as shown below.
Click on blank space to deselect.
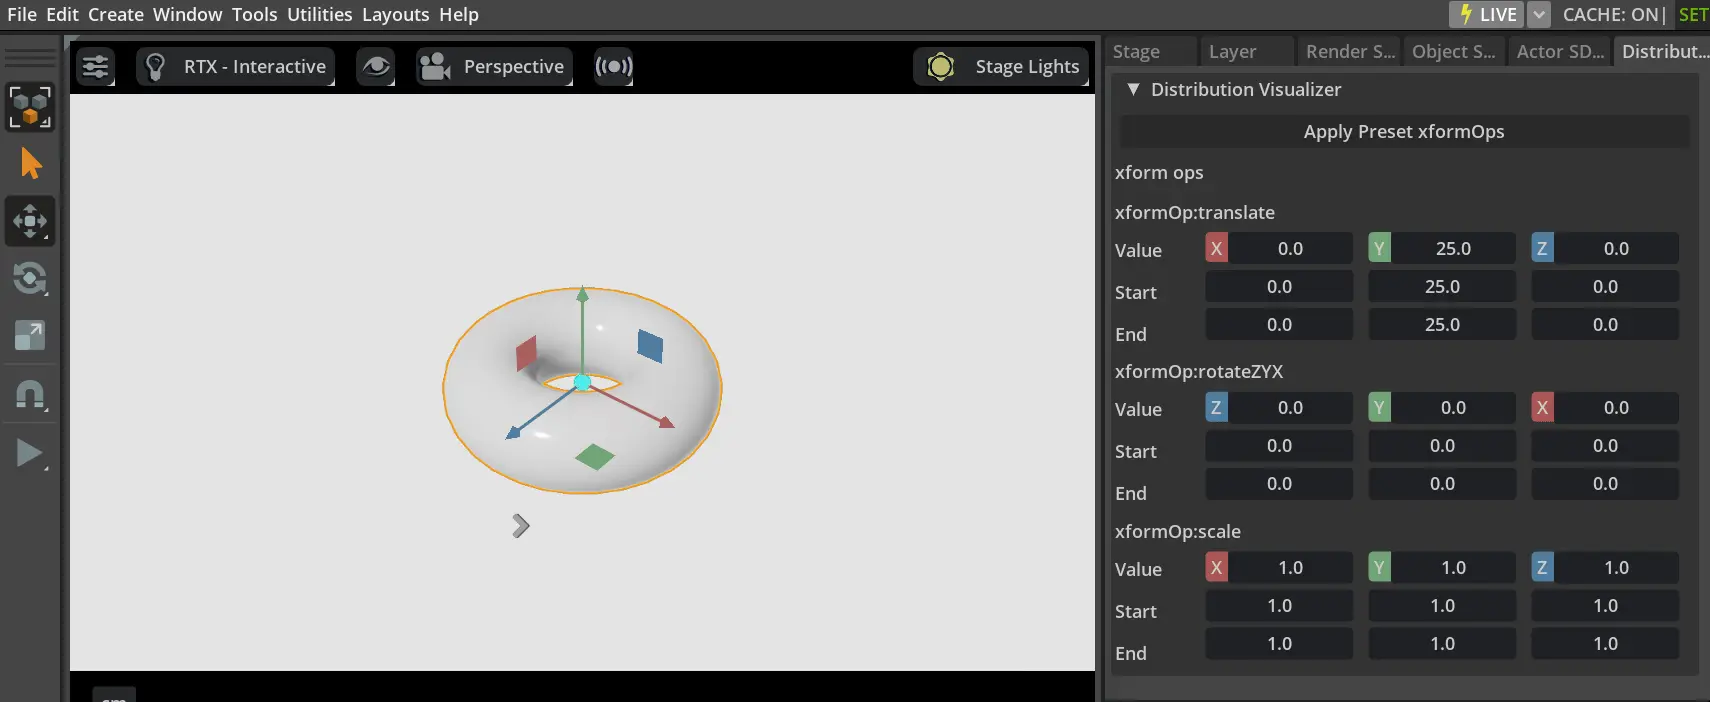
Click on the torus again so that the distribution visualizer is in sync with the selected prim and its
xformOpswill be visible in the distribution visualizer. By default, it has translate,rotateZYX, and scale.Apply preset
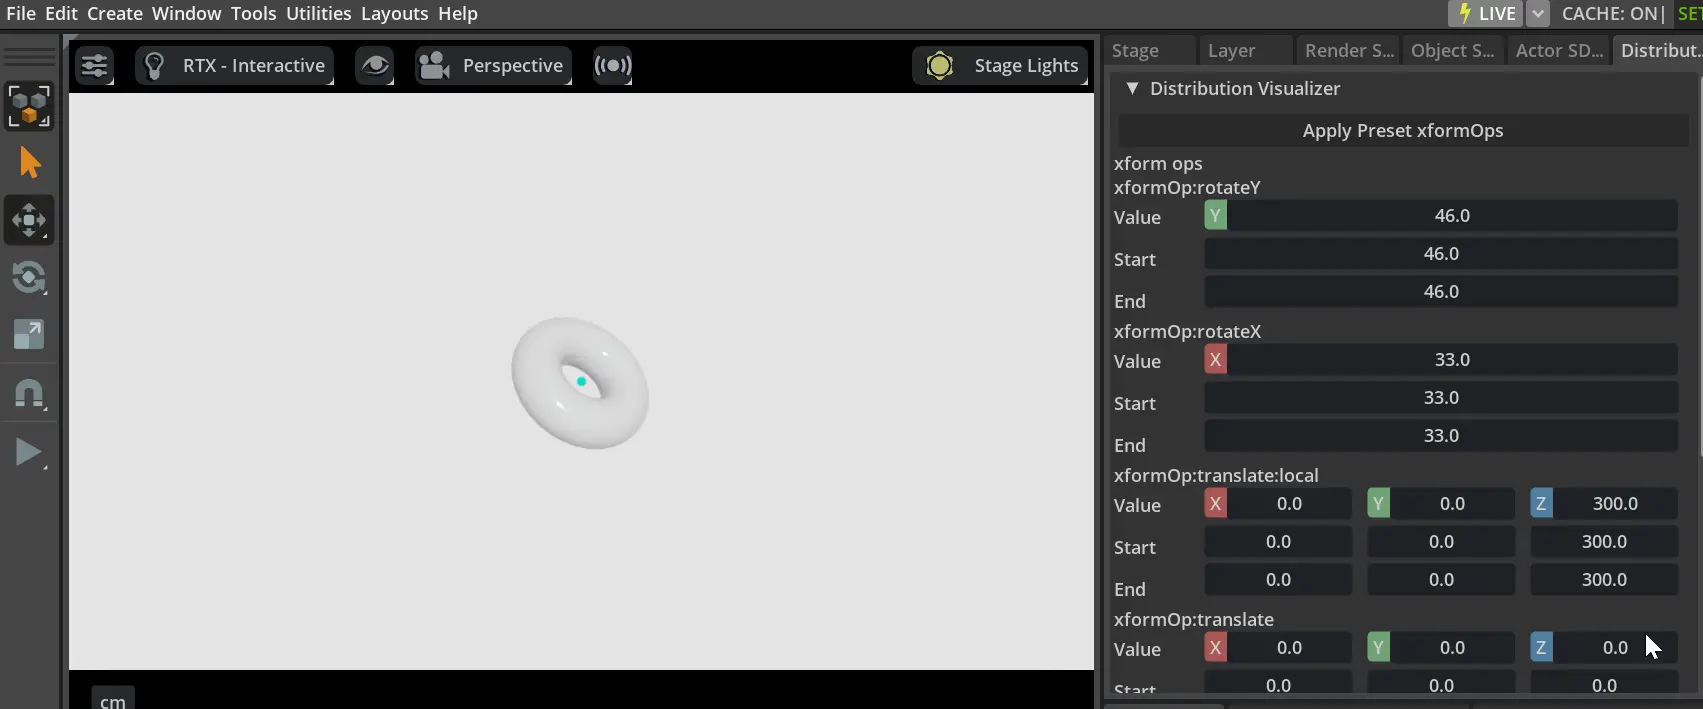
xformOpsto the torus, by clicking onApply Preset xformOps. This step is not needed for an ordinary prim; this is only to demonstrate the concept. You can observe the torus is now transformed to a new pose.Note
If the torus is not visible, press “F” on the keyboard to focus the active camera to look at it. If it’s still not visible, go to the stage tab and click on the torus to make sure it’s selected.
Click on blank space to deselect, and then click on the torus again. From global to local, the new
xformOpsarerotateY,rotateX, andtranslate.Each
xformOphas three lines:value
start
end
The value is the current value of the
xformOpand the start and end are the range of the value.Change the value of rotateY and rotateX to observe how the torus rotates. More information about the scene graph can be found in Transformation.
So far, the steps are shown below:
Adjust the range by changing the start and end of the
xformOps: rotateY, rotateX, and the Z-component of translate.Observe an animated shell that shows the distribution range of the torus:
To randomize a prim IRO in this way, insert a section like this in our description file:
basic_shape:
  type: geometry
  subtype: torus
  transform_operators:
  - rotateY:
      distribution_type: range
      start: -120
      end: 120
  - rotateX:
      distribution_type: range
      start: -30
      end: 30
  - translate:
      distribution_type: range
      start:
      - 0
      - 0
      - 200
      end:
      - 0
      - 0
      - 500