Empty Space Detection#
The empty space detector is an optional scene analysis step in isaacsim.replicator.object. You declare it as a top-level key in the description file (alongside other mutables) with detector_type: empty_space. At runtime the extension creates a temporary detector volume, voxelizes the region using ray casts, classifies free space, and writes 3D bounding boxes and 2D polygon footprints of detected empty regions into per-detector metadata. The implementation lives in EmptySpaceDetector (mutables/detector.py) and SpaceDetectManager (mutables/detector_internal/space_detect_manager.py).
Use it for workflows that need explicit free-space regions (for example bin packing, placement, or annotating voids) in addition to tracked object geometry.
When it Runs#
Detectors are initialized and run during the normal simulation workflow after the USD scene for the frame has been updated. The detector prim is removed from the stage when detection finishes. Enable visualization flags (see below) if you want to see scope, voxels, or height-span debug drawing in the viewport for that frame.
Scope geometry (required)#
Each detector entry must define a 3D axis-aligned scope. You can use either naming style:
Key |
Meaning |
Notes |
|---|---|---|
|
3-vector position of the detector volume |
Same units as the stage (typically meters when |
|
3-vector extent of the box |
Values are interpreted in centimeters; internally they are converted to meters for the USD transform (refer to |
Example (excerpt):
my_empty_space_detector:
  detector_type: empty_space
  translate: [0, 0, 0.25]
  scale: [500, 500, 200]   # centimeters: width, depth, height of the analysis region
Detection Parameters#
Detection Parameters are optional. These keys are read from the same detector block (the dictionary named after your detector, for example my_empty_space_detector). All numeric thresholds below are in meters unless your scene uses a different meters-per-unit convention. Defaults match EmptySpaceDetector.detect in the extension.
Key |
Type |
Default |
Description |
|---|---|---|---|
|
numeric |
|
Voxel / grid resolution along X and Y. |
|
numeric |
|
Minimum vertical clearance used when classifying empty height spans. |
|
numeric |
|
Minimum extent along X for a region to count as empty space. |
|
numeric |
|
Minimum extent along Y for a region to count as empty space. |
|
numeric |
|
Ratio used when filtering candidate regions (higher tends to retain more regions; range |
|
numeric |
|
Height tolerance at the top of a span. |
|
numeric |
|
Height tolerance at the bottom of a span. |
|
numeric / null |
|
Optional cap on stack height in meters; |
You can drive several of these from a single root-level macro (for example a shared cell_size in meters) using Macro expressions such as $[/cell_size] * 2.0.
Visualization#
Visualization is optional.
Key |
Type |
Description |
|---|---|---|
|
bool |
Draw 3D boxes for detected free regions and 2D polygon outlines when |
|
bool |
Draw raycast or height-span debug (for example yellow height-span visualization in the sample config). |
|
list |
RGBA for 3D bbox drawing; default |
|
list |
RGBA for 2D polygon outlines; default |
|
bool |
Show the detector scope as a wireframe when |
Visualization Color Legend#
When debug draw is available (isaacsim.util.debug_draw), the viewport uses the following default colors. You can change the 3D box and 2D outline colors with visualize_color and visualize_2d_color. The other colors listed below are fixed in space_detect_visualization.py.
Color (default) |
Meaning |
Notes |
|---|---|---|
Yellow wireframe (RGBA |
Detector scope (analysis volume) |
The axis-aligned box you defined with |
Red wireframe (default |
3D empty-space result |
One box per detected free region: edges of the 3D bounding boxes written to |
Green polylines (default |
2D empty-space result (footprint) |
Outlines of free regions projected to the ground plane (near |
Magenta ( |
Holes inside 2D regions |
Fixed color for hole boundaries; not controlled by YAML. |
If visualize_raycast is True, raycast and height-span debug lines are
drawn in addition to the colors above:
Color |
Meaning |
Notes |
|---|---|---|
Yellow vertical segments ( |
Per-voxel height span along the cast direction |
One vertical line per free height interval in the voxelization grid. |
Red points ( |
Base of each span |
Lower bound of a height interval. |
Green points ( |
Ceiling of each span |
Upper bound of a height interval. |
The raycast green points are not the same as the green 2D polygon outlines. Turn
off visualize_raycast if you only want the final 2D and 3D empty-space
overlays.
Outputs#
After detect completes, the extension stores results on the metadata entry for that detector key:
detected_space_3d: list of dicts withtranslateandscale(each axis-aligned free region in world space).detected_space_2d: serialized polygons (id,min_height,max_height,outline,holes) suitable for logging or downstream tools.
Exact consumption of these fields in written outputs depends on your output switches and description logging pipeline.
Example Configuration#
The extension ships a full demo that uses a Z-up stage, basic primitives on a floor, and an empty_space detector with macros and visualization enabled:
PATH_TO_CORE_EXTENSION/isaacsim/replicator/object/core/configs/demo_empty_space.yaml
Select that YAML from the Object SDG panel, or pass it as
--/config/file=... when running headless, to reproduce the workflow
end to end.
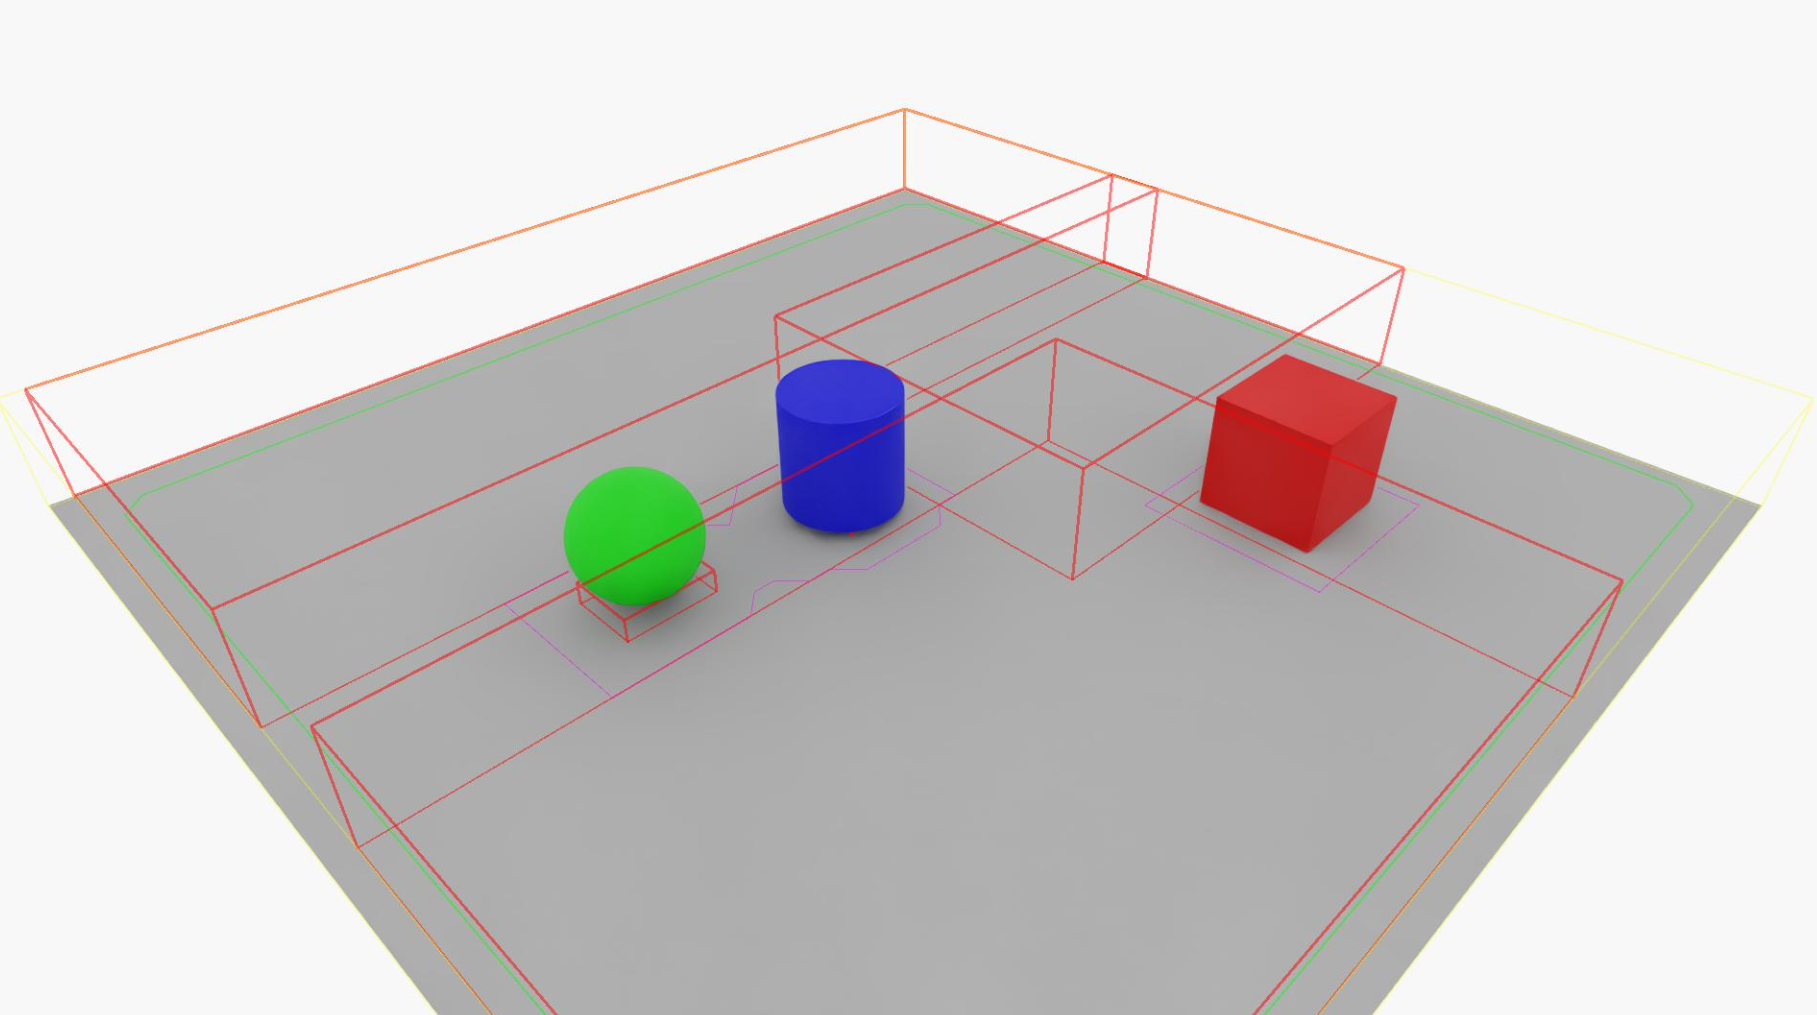
Viewport with demo_empty_space.yaml. The following colors appear in the
viewport:
Yellow wireframe: The detector scope.
Red boxes: 3D empty-space results.
Green outlines: 2D footprints.
When visualize_raycast is enabled, additional elements appear as described
in the preceding legend:
Yellow vertical segments: Raycast lines.
Red and green span points: Height-span sample points.